纺织学报 ›› 2024, Vol. 45 ›› Issue (05): 85-93.doi: 10.13475/j.fzxb.20221100901

• 染整工程 • 上一篇    下一篇

基于二维高斯核密度估计的有色纤维颜色特征提取方法

裘柯槟1(), 陈维国2,3, 张志强4, 黄为忠4   

  1. 1.嘉兴南湖学院 时尚设计学院, 浙江 嘉兴 314001
    2.浙江理工大学 纺织科学与工程学院(国际丝绸学院), 浙江 杭州 310018
    3.浙江理工大学桐乡研究院有限公司, 浙江 嘉兴 314500
    4.浙江厚源纺织股份有限公司, 浙江 嘉兴 314511
  • 收稿日期:2023-01-04 修回日期:2023-06-02 出版日期:2024-05-15 发布日期:2024-05-31
  • 作者简介:裘柯槟(1993—),男,讲师,博士。主要研究方向为纺织品的计算机测配色。E-mail:qkbing@outlook.com

Color feature extraction of colored fibers based on two-dimensional Gaussian kernel density estimation

QIU Kebin1(), CHEN Weiguo2,3, ZHANG Zhiqiang4, HUANG Weizhong4   

  1. 1. School of Fashion and Design, Jiaxing Nanhu University, Jiaxing, Zhejiang 314001, China
    2. College of Textile Science and Engineering (International Institute of Silk), Zhejiang Sci-Tech University, Hangzhou, Zhejiang 310018, China
    3. Zhejiang Sci-Tech University Tongxiang Research Institute, Jiaxing, Zhejiang 314500, China
    4. Zhejiang Houyuan Textile Co., Ltd., Jiaxing, Zhejiang 314511, China
  • Received:2023-01-04 Revised:2023-06-02 Published:2024-05-15 Online:2024-05-31

摘要:

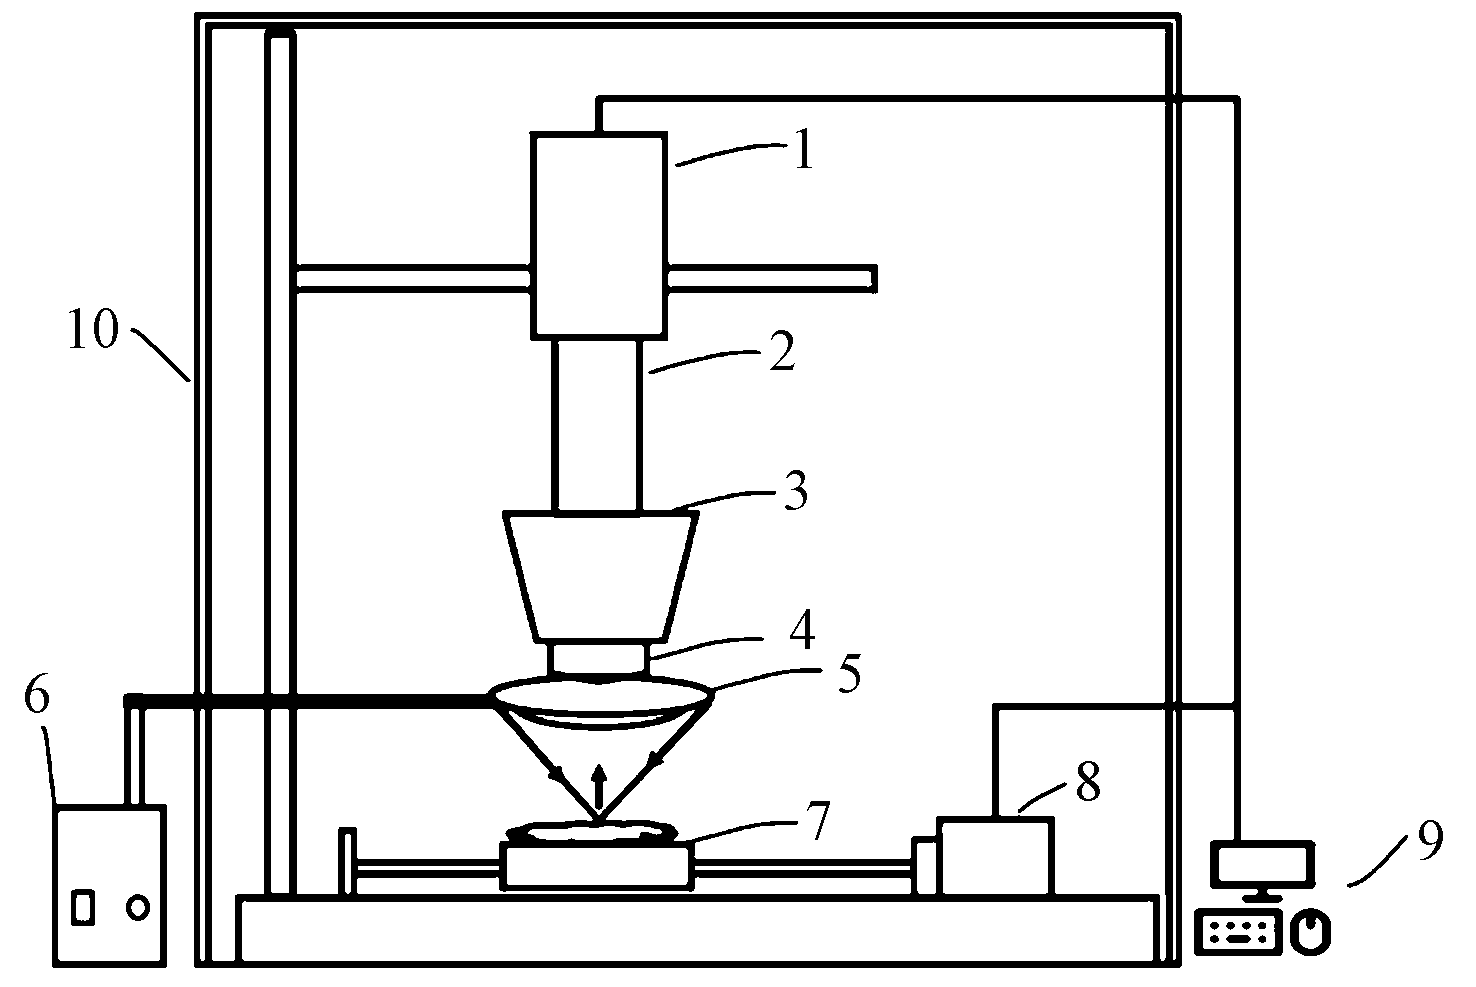
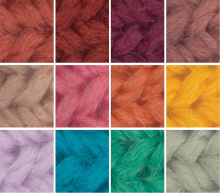
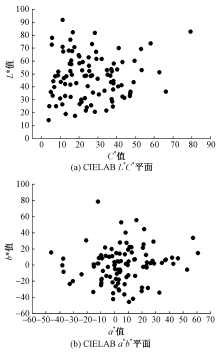
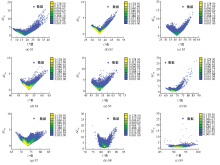
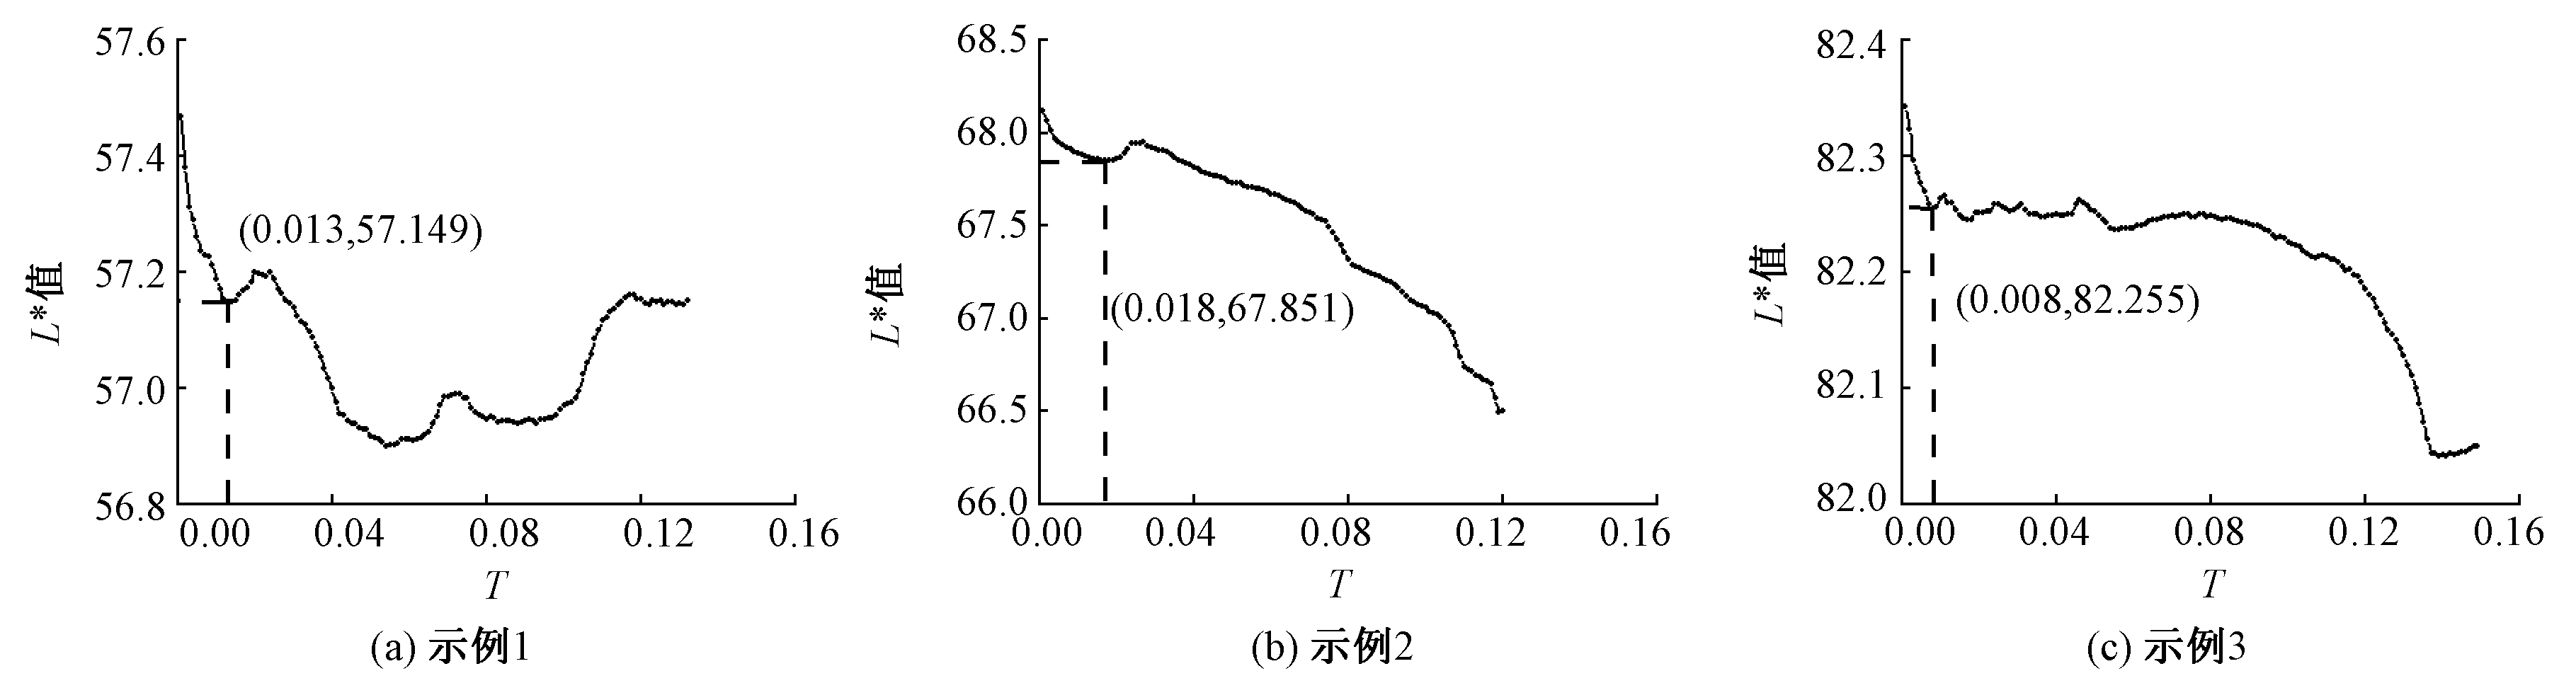
为提高基于显微高光谱成像的有色纤维颜色测量的准确性和可重复性,研究了一种基于二维高斯核密度估计的有色纤维颜色特征提取方法。首先通过显微高光谱成像测色系统采集有色纤维的高光谱图像,选择400~700 nm、波段间隔为10 nm的光谱反射率,将其转换为色度值CIE L*a*b*,计算纤维区域中的颜色均值与每个像元颜色的色差ΔE00,建立色差ΔE00L*相关联的二维数据;再基于二维高斯核密度估计方法计算像元的密度值,并确立了有色纤维的密度截断阈值估计方法,用于截断舍弃低密度的离散异常像元;最后根据像元的密度值计算加权光谱反射率并转换为相应的色度值。选取有色羊毛纤维进行实证分析,结果表明:影响颜色测量结果准确性和可重复性的离散异常像元主要存在于二维空间密度分布中的“尾部”区域,离散异常像元越多,“尾部”越长,对测量结果影响越严重;相比均值法和明度加权法,本文通过截断舍弃离散异常像元以减小其对测色结果影响的方式,提高了有色羊毛纤维颜色测量的准确性,且测量结果的可重复性最优,在有色羊毛纤维的染配色和混配色预测模型研究中具有实际应用价值。

关键词: 有色纤维, 显微高光谱成像, 颜色测量, 核密度估计, 颜色特征提取

Abstract:

Objective The diameters of the textile fibers are usually micrometer-grade, making it difficult to directly measure the colors of the textile fibers. A non-destructive and push-broom microscopic hyperspectral imaging system consisting of a stereomicroscope, an imaging spectrograph, and a digital detector shows an excellent spatial resolution for color measurement of colored textile fibers. In order to improve the accuracy and repeatability of the microscopic hyperspectral imaging system for colored textile fibers, a color feature extraction method of colored textile fibers based on two-dimensional Gaussian kernel density estimation was proposed.

Method The microscopic hyperspectral images of colored fibers were acquired by the microscopic hyperspectral imaging system. After preprocessing the hyperspectral images to obtain the spectral reflectance at 10 nm intervals over 400 to 700 nm, the fiber region of interest was chosen by the remote sensing image processing software (ENVI 4.8). The spectral reflectance was converted to chromatic values CIE L*a*b*, and the ΔE00 between the average color and each pixel color in the fiber region was computed. A two-dimensional relationship was established between the color difference ΔE00and L* in the textile fiber area to estimate the density value based on the two-dimensional Gaussian kernel density. In addition, a density threshold estimation method was proposed to truncate and remove low-density outliers. Finally, the weighted spectral reflectance with the corresponding density was converted to the colorimetric values.

Results Empirical analysis was performed using different colored wool fibers. The experimental results showed that the outliers (such as dust and highlight pixels) mainly existed in the tail in the two-dimensional spatial density distribution region, and the long tail indicated more outliers, which would result in a more serious impact on the accuracy and repeatability of color measurement results. In general, the relationship between L* and threshold T was similar among the colored wool fibers, and when T was between 0 and 0.02, the L* appeared to first decrease and then increase, indicating that the threshold value of T at the initial minimum lightness could be used as the density truncation threshold. The differences in L* among the color feature extraction methods were obvious for the majority of colored wool fibers, while the differences in C*, a* and b* were smaller. By truncating and removing the outliers, which would reduce the influence of outliers on the color measurement results, the lightness obtained by the proposed method was smallest. The lightness weighting method had worse repeatability than the proposed method, although both the proposed method and the lightness weighting method could improve the inter-class variation in the color. The possible reasons for this phenomenon could be that the lightness weighting method improved the interclass variability of fiber colors mainly by weighting the highlight pixels. The kernel density estimation method truncated and removed the low-density outliers on the one hand, and improved the weighting of normal pixels by two-dimensional Gaussian kernel density estimation on the other hand.

Conclusion The proposed method establishes a two-dimensional relationship between color difference ΔE00and L*, and effectively eliminates the effects of low-density outliers based on the two-dimensional Gaussian kernel density estimation. From the comparison results among the proposed method, the mean value method, and the lightness weighting method, the differences in L* are obvious for the majority of colored wool fibers, while the differences in C*, a*, and b* become smaller. In terms of chromatic values, the proposed method can improve the accuracy and repeatability of color measurement based on microscopic hyperspectral imaging for colored wool fibers, which would lay a foundation for the study of dyeing and blending prediction models for colored wool fibers.

Key words: colored fiber, microscopic hyperspectral imaging, color measurement, kernel density estimation, feature extraction

中图分类号: 

  • TS101.8

图1

显微高光谱成像测色系统的结构示意图 1—CCD相机;2—成像光谱仪;3—显微镜;4—辅助物镜;5—环形光源;6—光源控制装置;7—载物台;8—步进电动机;9—计算机;10—暗箱。"

图2

有色羊毛纤维的彩色图像"

图3

有色羊毛纤维数据集的颜色特征分布"

表1

有色羊毛纤维的色度值CIE L*a*b*和明度特征"

编号 CIE L*a*b*平均值 L*特征
L* a* b* 标准差 中位数
S1 17.535 0.950 -17.132 5.438 16.975
S2 36.222 32.758 -34.159 3.000 35.886
S3 42.305 -11.836 1.836 4.410 42.243
S4 51.417 60.889 14.990 2.408 51.116
S5 52.821 9.923 18.962 3.150 52.624
S6 67.280 28.957 1.175 2.491 67.031
S7 73.709 15.916 55.773 2.213 73.229
S8 82.366 14.731 7.417 1.693 82.304
S9 91.998 -1.766 10.982 1.402 91.831

图4

有色羊毛纤维的二维空间密度分布"

图5

阈值T与有色羊毛纤维的L*值的关系"

图6

不同颜色特征提取方法提取的有色羊毛纤维颜色对比"

图7

色差ΔE00分别与色差分量ΔL*、Δa*和Δb*的线性拟合关系"

表2

有色羊毛纤维颜色特征的类间差异度"

参数 方法 样本数 平均值 标准差
L* 均值法 100 47.812 16.955
明度加权法 47.774 17.151
核密度估计法 47.362 17.102
a* 均值法 100 6.023 19.866
明度加权法 6.056 20.363
核密度估计法 6.242 20.014
b* 均值法 100 0.004 22.000
明度加权法 0.017 20.868
核密度估计法 -0.304 22.172

表3

不同颜色特征提取方法之间的可重复性比较"

样本
编号
均值法 明度加权法 核密度估计法
平均
色差
色差
标准差
平均
色差
色差
标准差
平均
色差
色差
标准差
N1 0.145 0.084 0.158 0.091 0.141 0.081
N2 0.516 0.227 0.517 0.229 0.519 0.225
N3 0.119 0.059 0.120 0.064 0.125 0.022
N4 0.079 0.036 0.079 0.050 0.074 0.034
N5 0.162 0.046 0.138 0.041 0.099 0.028
[1] 衡冲, 沈华, 王府梅. 数字化羊绒测色法及其在长度测量中的应用[J]. 纺织学报, 2020, 41(12): 42-48.
doi: 10.13475/j.fzxb.20200205307
HENG Chong, SHEN Hua, WANG Fumei. Digital cashmere color measurement and its application in length measurement[J]. Journal of Textile Research, 2020, 41(12): 42-48.
doi: 10.13475/j.fzxb.20200205307
[2] 李戎, 宋阳, 黄劲旭, 等. 有色纤维的配色方法研究[J]. 湖南科技大学学报(自然科学版), 2006(4): 83-87.
LI Rong, SONG Yang, HUANG Jinxu, et al. Study on color matching of pre-colored fiber blends[J]. Journal of Hunan University of Science & Technology (Natural Science Edition), 2006 (4): 83-87.
[3] 车江宁, 陈东辉. 纤维状样品测色方法的研究[J]. 印染, 2001(6):39-41,4.
CHE Jiangning, CHEN Donghui. Research on color measuring method for fibrous sample[J]. China Dyeing & Finishing, 2001(6):39-41,4.
[4] 张戈, 周建, 王蕾, 等. 用分光光度计法测量纤维颜色的影响因素[J]. 纺织学报, 2020, 41(4): 72-77.
ZHANG Ge, ZHOU Jian, WANG Lei, et al. Influencing factors for fiber color measurement by spectrophotometer[J]. Journal of Textile Research, 2020, 41(4): 72-77.
[5] 钱爱芬. 色纺纱产品特点及调配色原理[J]. 棉纺织技术, 2010, 38(11): 66-68.
QIAN Aifen. Colored spun yarn characteristic and color mixing & matching principle[J]. Cotton Textile Technology, 2010, 38(11): 66-68.
[6] 白婧, 杨柳, 张毅, 等. 纯棉色纺纱配色中的Stearns-Noechel模型参数优化[J]. 纺织学报, 2018, 39(3): 31-37.
BAI Jing, YANG Liu, ZHANG Yi, et al. Parameters optimization of Stearns-Noechel model in color matching of cotton colored spun yarn[J]. Journal of Textile Research, 2018, 39(3): 31-37.
[7] 卢雨正, 高卫东. 基于图像分割的拼色纺织品分色算法[J]. 纺织学报, 2012, 33(9): 55-60.
LU Yuzheng, GAO Weidong. Color separation algorithm for mixed dyed textiles based on image segment-ation[J]. Journal of Textile Research, 2012, 33(9): 55-60.
[8] 沈利利, 李忠健, 潘如如, 等. 色纺纱线中纤维混色比例的图像检测[J]. 纺织学报, 2016, 37(3): 138-143.
SHEN Lili, LI Zhongjian, PAN Ruru, et al. Image inspection of fiber blending percentages in colored spun yarns[J]. Journal of Textile Research, 2016, 37(3): 138-143.
[9] QIU K, CHEN W, ZHOU H, et al. Evaluation of the color measurement based on a microscopic hyperspectral imaging system[J]. Color Research and Application, 2021, 46(6): 1205-1217.
[10] ZHANG J, WU J, ZHANG X, et al. Color measurement of single yarn based on hyperspectral imaging system[J]. Color Research and Application, 2020, 45(3): 485-494.
[11] SCHANDA J, ILLUMINATION I C. Colorimetry: understanding the CIE system[M]. Hoboken: John Wiley & Sons Inc., 2007: 25-78.
[12] 石凯, 聂富强, 孙峰. 多维数据判别分析的非参核密度算法研究[J]. 计算机工程与应用, 2019, 55(6): 8-12,30.
doi: 10.3778/j.issn.1002-8331.1808-0257
SHI Kai, NIE Fuqiang, SUN Feng. Research on algorithm of nonparametric kernel density for discriminant analysis of multidimensional data[J]. Computer Engineering and Applications, 2019, 55(6):8-12,30.
doi: 10.3778/j.issn.1002-8331.1808-0257
[13] QIU K, CHEN W, SHEN J, et al. A novel 3D convolutional neural network model with supervised spectral regression for recognition of hyperspectral images of colored wool fiber[J]. Color Research & Application, 2022, 47(5): 1105-1117.
[1] 裘柯槟, 陈维国, 周华. 用光谱成像技术与分光光度法测量织物颜色的比较分析[J]. 纺织学报, 2020, 41(11): 73-80.
[2] 裘柯槟, 陈维国, 周华, 应双双. 成像技术在纺织品颜色测量中的应用进展[J]. 纺织学报, 2020, 41(09): 155-161.
[3] 应双双, 裘柯槟, 郭宇飞, 周赳, 周华. 纺织品色彩管理色表测量数据的误差优化[J]. 纺织学报, 2020, 41(08): 74-80.
[4] 张戈, 周建, 王蕾, 潘如如, 高卫东. 用分光光度计法测量纤维颜色的影响因素[J]. 纺织学报, 2020, 41(04): 72-77.
[5] 张孝超 李平 金福江. 应用图像空域法的针织物密度在线测量[J]. 纺织学报, 2015, 36(11): 138-145.
[6] 汤仪平;金福江. 间歇式染色过程中针织物颜色预测的算法[J]. 纺织学报, 2010, 31(11): 104-108.
[7] 李戎;宋阳;顾峰. 基于Stearns-Noechel模型的纤维光谱配色算法[J]. 纺织学报, 2007, 28(1): 77-80.
[8] 周平.;汪亚明;朱森勇. 时-空域多特征证据学习与增强的印染疵点在线检测[J]. 纺织学报, 2006, 27(5): 1-5.
[9] 纪雷;孙健;林雨霏;蔡发;杜恒清;昃向君. 内核密度分布与自举法对纺织品镉含量代表值估计[J]. 纺织学报, 2006, 27(12): 17-20.
[10] 陈雁;李栋高. 服装颜色风格的客观评价[J]. 纺织学报, 2003, 24(01): 80-82.
[11] 车江宁;陈东辉. 天然色棉织物测配色[J]. 纺织学报, 2000, 21(03): 62-64.
Viewed
Full text


Abstract

Cited

  Shared   
  Discussed   
No Suggested Reading articles found!