纺织学报 ›› 2024, Vol. 45 ›› Issue (06): 89-97.doi: 10.13475/j.fzxb.20221201501

• 纺织工程 • 上一篇    下一篇

基于多度量多模型图像投票的织物表面瑕疵检测方法

朱凌云1,2(), 王晨宇2, 赵悦莹2   

  1. 1.重庆理工大学 计算机科学与工程学院, 重庆 400054
    2.重庆理工大学 两江国际学院, 重庆 401135
  • 收稿日期:2023-01-21 修回日期:2024-03-01 出版日期:2024-06-15 发布日期:2024-06-15
  • 作者简介:朱凌云(1969—),男,副教授,博士。主要研究方向为计算机视觉、无人自主系统,生物医学计算。E-mail:zhulingyun@cqut.edu.cn
  • 基金资助:
    重庆市巴南区科技计划项目(2018TJ02);重庆市巴南区科技计划项目(2020QC430);重庆理工大学研究生教育高质量发展项目(gzlcx20223133)

Detection of fabric surface defects based on multi-metric-multi-model image voting

ZHU Lingyun1,2(), WANG Chenyu2, ZHAO Yueying2   

  1. 1. College of Computer Science and Engineering, Chongqing University of Technology, Chongqing 400054, China
    2. Liangjiang International College, Chongqing University of Technology, Chongqing 401135, China
  • Received:2023-01-21 Revised:2024-03-01 Published:2024-06-15 Online:2024-06-15

摘要:

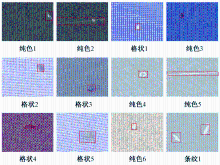
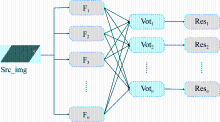
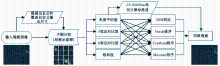
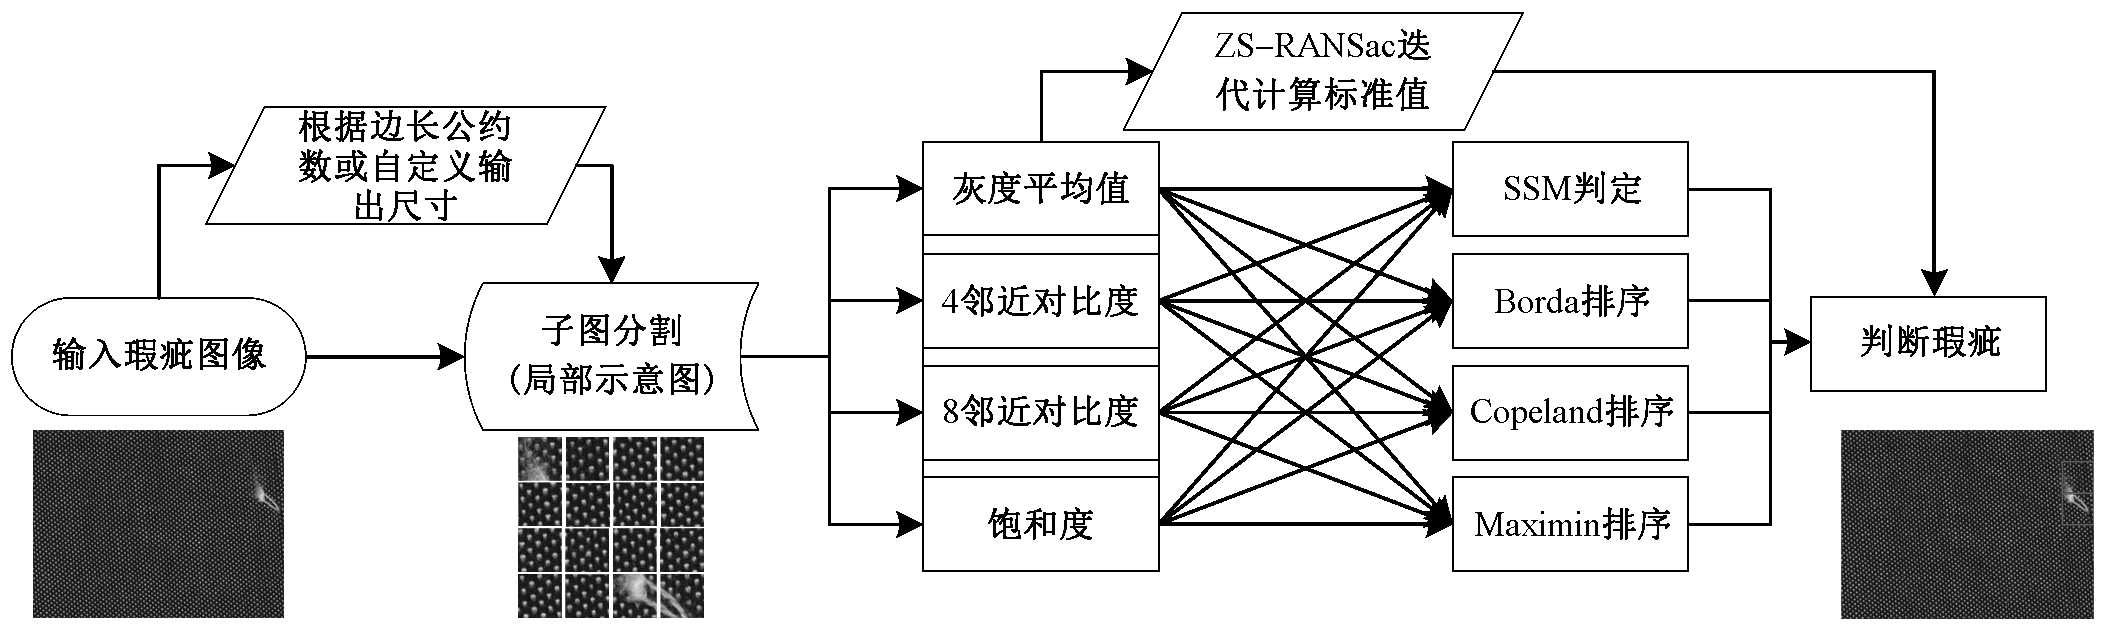
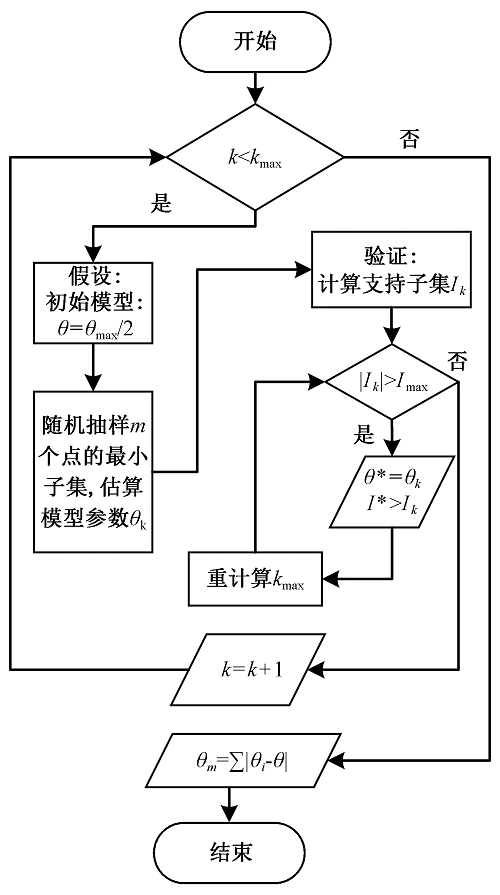
为解决自动化生产线上织物表面瑕疵检测准确率低和计算速度慢的问题,利用织物表面具有周期纹理的特性提出了一种改进的RANSac检测方法,即多度量多模型图像投票。首先将输入图像裁剪为尺寸一致的子图,计算出子图多维度量的输出值矩阵;然后与改进RANSac计算出的无瑕疵背景的多维度量标准值分别对应作差,采用投票得出每张子图的基础分;再将其在4个记数模型下得到的综合评分排序,根据顺序和偏移量在输出端得到外点所代表的瑕疵子图。实验结果表明:在自采样的织物瑕疵数据集上,选择单度量和单模型的预测精度平均可达到90.9%,平均预测时间达到0.139 s,综合多度量多模型投票的平均预测精度可达到92.7%。该算法不需要大量前期数据进行训练,适用于纯色和条纹状织物的实时表面缺陷检测。

关键词: 目标检测, 周期纹理, 织物表面瑕疵检测, 零斜率RANSac, 多度量多模型图像投票

Abstract:

Objective Fabric surface defects influence the textile output, quality, price, and other factors directly, and it is hence necessary to devise a method for detecting fabric surface defects quickly and accurately in automatic production lines. This research aims to establish a statistical algorithm to achieve rapid detection of fabric surface defects.

Method Partial defects on the fabric surface could destroy its periodic geometric and statistical characteristics. Based on this feature, a detection method combining with an improved RANSac, named multi-metric-multi-model image voting (MMIV), was proposed. The input image was firstly divided into sub-images of the same size, and the output value matrix of the sub-image multi-dimensional metric was calculated. They were different from the multi-dimensional measurement standard values of the flawless background calculated by the improved Zero-Slope-RANSac method, and the basic scores of each sub-image were obtained by voting. Then the comprehensive scores obtained under the 4 counting models(square of standard mean, Borda, Copeland, Maximin) were sorted, finally, the defect sub-image represented by the outer point was obtained at the output end according to the sequence and offset.

Result The tested subjects were the self-sampled fabric defect dataset. When the RANSac method parameter was set to 3 and threshold set to 2, the confidence was greater than 0.25 and the prediction accuracy of single-measure-single-model reached 89.3% on average. The prediction accuracy reached 95.6% when the gray mean measure and Borda ranking model were selected, which was the highest, while the square of standard mean model (SSM model) had the lowest accuracy. Accuracy under 4-measures-3-models showed the prediction of 2 565 grey fabric images with non-latticed texture, and that of 3 708 grey fabric images with latticed texture background. The confidences of the both tables were greater than 0.35, and the prediction accuracy of each model was compared with the values of RANSac parameter set from 1 to 3, and the threshold set from 1 to 4. The prediction accuracy of Borda, Copeland, and Maximin points of the last three counting models was better than that of the SSM method. The average prediction accuracy of the combined multi-metric-multi-model image voting reached 92.7%, demonstrating a significant detection effect. By means of comparing non-lattice and lattice, it can be seen that the optimization of the multi-metric-multi-model image voting strategy was not applicable to lattice texture for the time being. Under the condition that high detection accuracy can be guaranteed, the detection speed of ZS-RANSac with 200 iterations was more than 5 times that of 1 000 iterations, meanwhile, the detection time reached only 0.466 s, satisfying the real-time performance of pipeline work. Among the four prediction models, the SSM model was 10 times faster than the other three models, and the average time of the other three models were relatively close, reaching the fastest 0.135 s of the Copeland model. Considering accuracy and real-time performance, the Borda counting model demobnstrated the best results.

Conclusion It can be seen from the experimental results that, the proposed algorithm can detect defects on the fabric surface for periodic texture images quickly and accurately, and a new dichotomy labeled dataset for periodic texture grey fabric was created. The algorithm does not require a large amount of preliminary data for training, can overcome the problem of the lack of public datasets in the industry to a certain extent, and is suitable for real-time defect detection of solid color and striped background fabric. This technology is able to reduce the labor cost of the factory in the industrial entity under certain circumstances, and provides an idea to apply the software statistical prediction method to the research of image algorithms. Future work would focus on metric screening and model optimization in multi-metric-multi-model image voting(MMIV),as well as adaptive optimization of RANSac involved parameters, to further improve detection accuracy and average detection speed.

Key words: object detection, periodic texture, fabric surface defect detection, zero-slope-RANSac, multi-metric-multi-model image voting

中图分类号: 

  • TP391

图1

数据集标注示例"

图2

多度量多模型图像投票法的逻辑结构"

图3

缺陷预测总流程"

图4

ZS-RANSac算法流程图"

图5

示例图像的局部得分矩阵S"

表1

3个模型下10个子图点投票得分S1"

Sub-Num(子图号) BO CO MA
1(A) 18 6 4
2(B) 18 6 4
3(C) -2 0 2
4(D) 38 9 6
5(E) -2 0 2
6(F) -22 -7 0
7(G) -2 0 2
8(H) -2 0 2
9(I) -22 -7 0
10(J) -22 -7 0

图6

子图标号评价法"

表2

度量-模型预测结果"

置信度 灰度平均值 4邻近对比 8邻近对比 饱和度 平均
-SSM -Bor -Cop -Max -Bor -Cop -Max -Bor -Cop -Max -SSM -Bor -Cop -Max
>0.25 0.224 0.956 0.949 0.949 0.917 0.912 0.912 0.912 0.914 0.914 0.257 0.640 0.912 0.830 0.893
>0.35 0.214 0.909 0.901 0.902 0.864 0.859 0.859 0.864 0.857 0.857 0.249 0.600 0.849 0.771 0.841
>0.45 0.726 0.716 0.718 0.681 0.676 0.676 0.679 0.669 0.669 0.462 0.641 0.579 0.658
>0.55 0.474 0.473 0.474 0.418 0.414 0.414 0.419 0.41 0.409 0.310 0.384 0.366 0.414

表3

四度量-三模型下检测准确率(非格状)"

置信
灰度平均值 4邻近对比 8邻近对比 饱和度 综合
-Bor -Cop -Max -Bor -Cop -Max -Bor -Cop -Max -Bor -Cop -Max
e1t1 0.922 0.918 0.920 0.860 0.853 0.860 0.855 0.848 0.852 0.606 0.856 0.784
e1t2 0.919 0.920 0.917 0.866 0.859 0.859 0.864 0.857 0.855 0.603 0.855 0.773
e1t3 0.922 0.920 0.919 0.865 0.858 0.850 0.853 0.846 0.850 0.613 0.857 0.784
e1t4 0.920 0.917 0.917 0.868 0.860 0.860 0.858 0.850 0.856 0.604 0.863 0.788
e2t1 0.915 0.907 0.908 0.862 0.853 0.853 0.857 0.850 0.858 0.600 0.848 0.772
e2t2 0.913 0.911 0.908 0.863 0.853 0.854 0.858 0.852 0.860 0.594 0.837 0.767
e2t3 0.915 0.911 0.908 0.863 0.854 0.857 0.854 0.848 0.856 0.613 0.843 0.773
e2t4 0.911 0.910 0.912 0.863 0.856 0.851 0.862 0.855 0.851 0.605 0.844 0.775
e3t1 0.899 0.902 0.900 0.865 0.858 0.853 0.858 0.851 0.848 0.603 0.850 0.772
e3t2 0.909 0.901 0.902 0.864 0.859 0.859 0.864 0.857 0.854 0.600 0.849 0.771 0.927
e3t3 0.908 0.898 0.903 0.858 0.850 0.858 0.858 0.850 0.845 0.604 0.858 0.770

图7

不同置信度下不同测度和模型的检测效果趋势"

图8

部分样例检测结果"

[1] 李晓钟, 胡珊. 中国纺织产业在全球价值链的地位及升级研究[J]. 国际经济合作, 2018(3):44-49.
LI Xiaozhong, HU Shan. Research on the status and upgrading of Chinese textile industry in global value chain[J]. World Economy and Trade, 2018(3):44-49.
[2] SRINIVASAN K, DASTOOR P H, RADHAKRISHNAIAH P, et al. FDAS: a knowledge-based framework for analysis of defects in woven textile structures[J]. The Journal of the Textile Institute, 1992, 83(3): 431-448.
[3] 吕文涛, 林琪琪, 钟佳莹, 等. 面向织物疵点检测的图像处理技术研究进展[J]. 纺织学报, 2021, 42(11):197-206.
doi: 10.13475/j.fzxb.20200702710
LÜ Wentao, LIN Qiqi, ZHONG Jiaying, et al. Research progress of image processing technology for fabric defect detection[J]. Journal of Textile Research, 2021, 42(11):197-206.
doi: 10.13475/j.fzxb.20200702710
[4] 田宸玮, 王雪纯, 杨嘉能, 等. 织物瑕疵检测方法研究进展[J]. 计算机工程与应用, 2020, 56(12):8-18.
doi: 10.3778/j.issn.1002-8331.2002-0169
TIAN Chenwei, WANG Xuechun, YANG Jianeng, et al. Research progress on fabric defect detection me-thods[J]. Computer Engineering and Applicationss, 2020, 56(12):8-18.
[5] 赵艳, 左保齐. 机器视觉在织物疵点检测上的应用研究综述[J]. 计算机工程与应用, 2020, 56(2):11-17.
doi: 10.3778/j.issn.1002-8331.1908-0193
ZHAO Yan, ZUO Baoqi. Analysis on application of machine vision in fabric defect detection[J]. Computer Engineering and Applicationss, 2020, 56(2):11-17.
[6] 师昕, 赵雪青. 基于视觉感知机制的织物疵点轮廓检测[J]. 计算机系统应用, 2021, 30(11):323-328.
SHI Xin, ZHAO Xueqing. Fabric defect contour detection based on visual mechanism[J]. Computer Systems & Applications, 2021, 30(11):323-328.
[7] ZHU D, PAN R, GAO W,et al. Yarn-dyed fabric defect detection based on autocorrelation function and GLCM[J]. Autex Research Journal, 2015, 15(3): 226-232.
[8] 狄岚, 杨达, 梁久祯, 等. 基于图元分割与Gabor滤波的织物瑕疵检测方法[J]. 纺织学报, 2020, 41(9):59-66.
DI Lan, YANG Da, LIANG Jiuzhen, et al. Fabric defect detection method based on primitive segmentation and Gabor filtering[J]. Journal of Textile Research, 2020, 41(9):59-66.
[9] 谢景洋, 王巍, 刘婷. 基于YOLO v3算法的不同主干网络对织物瑕疵检测[J]. 测控技术, 2021, 40(3):61-66.
XIE Jingyang, WANG Wei, LIU Ting. Fabric surface defect detection based on YOLO v3 with different backbone networks[J]. Measurement & Control Technology, 2021, 40(3):61-66.
[10] 陈金广, 李雪, 邵景峰, 等. 改进YOLOv5网络的轻量级服装目标检测方法[J]. 纺织学报, 2022, 43(10):155-160.
doi: 10.13475/j.fzxb.20210809306
CHEN Jinguang, LI Xue, SHAO Jingfeng, et al. Lightweight clothing detection method based on an improved YOLOv5 network[J]. Journal of Textile Research, 2022, 43(10):155-160.
doi: 10.13475/j.fzxb.20210809306
[11] 蔡兆信, 李瑞新, 戴逸丹, 等. 基于Faster RCNN的布匹瑕疵识别系统[J]. 计算机系统应用, 2021, 30(2):83-88.
CAI Zhaoxin, LI Ruixin, DAI Yidan, et al. Fabric defect recognition system based on faster RCNN[J]. Computer Systems & Applications, 2021, 30(2):83-88.
[12] 宫丽娜, 姜淑娟, 姜丽. 软件缺陷预测技术研究进展[J]. 软件学报, 2019, 30(10):3090-3114.
GONG Lina, JIANG Shujuan, JIANG Li. Research progress of software defect prediction[J]. Journal of Software, 2019, 30(10):3090-3114.
[13] 李勇, 黄志球, 王勇, 等. 数据驱动的软件缺陷预测研究综述[J]. 电子学报, 2017, 45(4):982-988.
doi: 10.3969/j.issn.0372-2112.2017.04.030
LI Yong, HUANG Zhiqiu, WANG Yong, et al. Survey on data driven software defects prediction[J]. Acta Electronica Sinica, 2017, 45(4):982-988.
doi: 10.3969/j.issn.0372-2112.2017.04.030
[14] 赵谦, 童申鑫, 贺顺, 等. 改进的SURF-RANSAC图像匹配算法[J]. 计算机工程与设计, 2021, 42(10):2902-2909.
ZHAO Qian, TONG Shenxin, HE Shun, et al. Improved SURF-RANSAC image matching algorithm[J]. Computer Engineering and Design, 2021, 42(10):2902-2909.
[15] DEJAEGER K, VERBEKE W, MARTENS D, el al. Data mining techniques for software effort estimation: a comparative study[J]. IEEE Transactions on Software Engineering. 2012, 38(2): 375-397.
[1] 池盼盼, 梅琛楠, 王焰, 肖红, 钟跃崎. 基于边缘填充的单兵迷彩伪装小目标检测[J]. 纺织学报, 2024, 45(01): 112-119.
[2] 陈金广, 李雪, 邵景峰, 马丽丽. 改进YOLOv5网络的轻量级服装目标检测方法[J]. 纺织学报, 2022, 43(10): 155-160.
[3] 王晓华, 姚炜铭, 王文杰, 张蕾, 李鹏飞. 基于改进YOLO深度卷积神经网络的缝纫手势检测[J]. 纺织学报, 2020, 41(04): 142-148.
[4] 刘正东, 刘以涵, 王首人. 西装识别的深度学习方法[J]. 纺织学报, 2019, 40(04): 158-164.
[5] 徐增波 周胜. 基于尺度-空间极值的织物起球目标检测[J]. 纺织学报, 2013, 34(7): 45-51.
Viewed
Full text


Abstract

Cited

  Shared   
  Discussed   
No Suggested Reading articles found!